The “High Return” Trap
You see a fund with 25% returns. Impressive, right? Your first thought is probably: “This is a great fund. I should invest.”
But what if I told you that a fund with 18% returns might actually be the better choice?
Sounds strange, doesn’t it? But this is exactly where most investors go wrong. They chase the highest number. They assume more return means a better fund.
What they miss is the risk taken to achieve those returns.
A fund can deliver 25% returns by taking big, concentrated bets. It might load up on a handful of volatile stocks. Or bet heavily on a single sector. When those bets work, the returns look amazing. But when they don’t? The losses can be brutal.
This is the problem with looking at returns alone. It tells you what happened. But not how it happened. It tells you the destination. But not how bumpy the ride was.
The sharpe ratio solves this problem. It tells you if a fund’s returns were genuinely good, or just a product of taking excessive risk. It separates skill from luck.
By the end of this post, you’ll understand what the Sharpe Ratio is. Why does it matters. And exactly how to use it when selecting mutual funds.
You’ll never look at a fund’s return number the same way again.
But first, let’s understand why looking at returns alone is so misleading.
The Problem Returns Alone Can’t Be Solved
Think of two funds. Both have delivered decent returns over the last five years. On paper, they might look similar. But dig deeper, and the story changes completely.
One fund achieved its returns with a smooth, steady climb. The other fund achieved it with wild swings, massive gains one year, step losses the next. Both ended at the same place. But the journey was completely different.
As an investor, which one would you prefer? The answer is obvious. The one with the smoother ride.
This is the problem with average returns. They hide the truth. They tell you the final score. But not the story behind it.
A fund with high volatility can make you rich. Or it can make you panic and sell at the worst possible time.
This is where Standard Deviation comes in. It measures how much a fund’s returns fluctuate from its average.
Higher standard deviation = More volatility.
Lower standard deviation = Smoother ride.
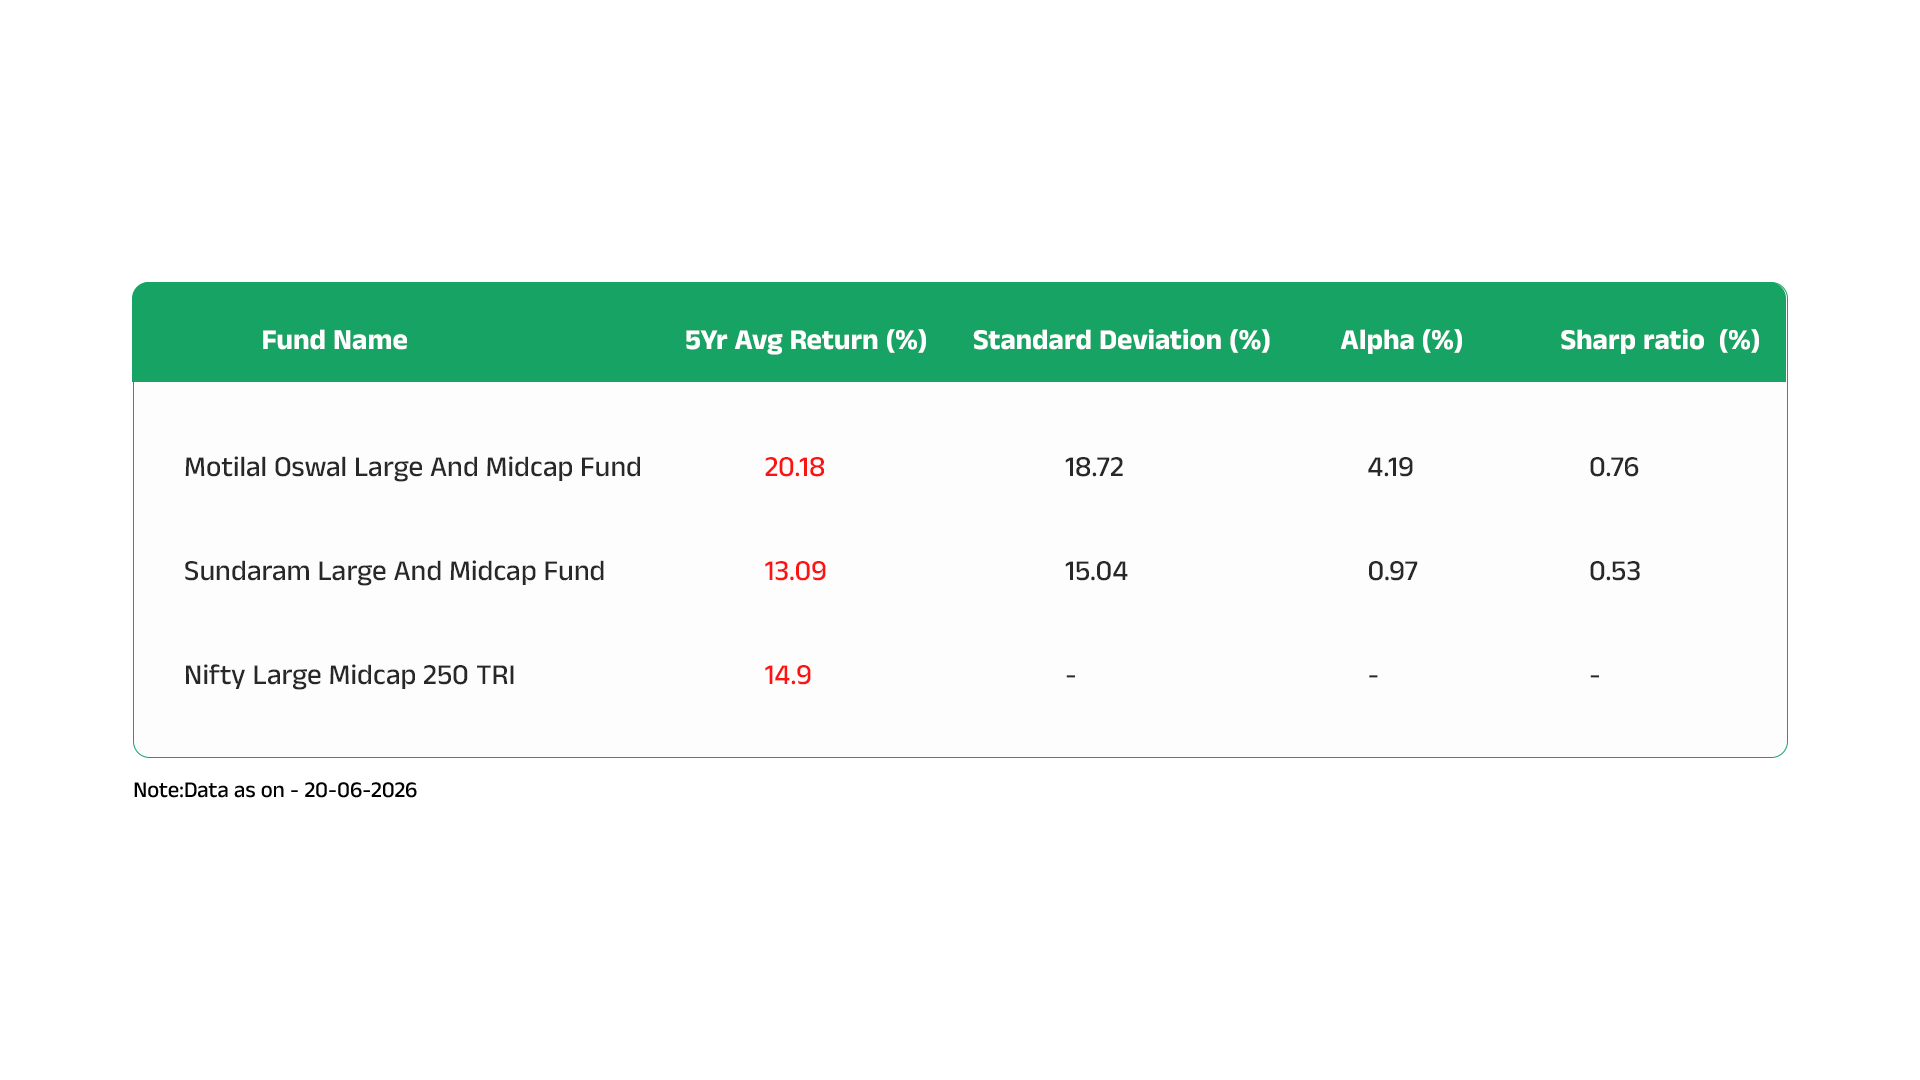
Look at the data. Motilal Oswal delivered 20.18% returns, much higher than Sundaram’s 13.09% and even the benchmark’s 14.9%. But it also had higher volatility. Its standard deviation was 18.72% compared to Sundaram’s 15.04%.
So which fund is better?
Based on returns alone, Motilal Oswal looks like the clear winner. But based on risk, Sundaram offered a smoother ride.
The real question is: Was the extra return worth the extra risk?
Average returns alone can’t answer this. This is exactly why the Sharpe Ratio was created.
That’s where the Sharpe Ratio comes in. It finally answers the question: “Were these returns worth the risk?”
The Birth of the Sharpe Ratio
So, who came up with this metric that finally answers the risk-reward question?
It was William F. Sharpe, a Nobel Laureate in Economics. He introduced the Sharpe Ratio in 1966. At that time, investors had no standard way to compare funds with different risk profiles. You could look at returns. You could look at volatility. But there was no single number that combined both.
Sharpe solved this problem with a simple formula:
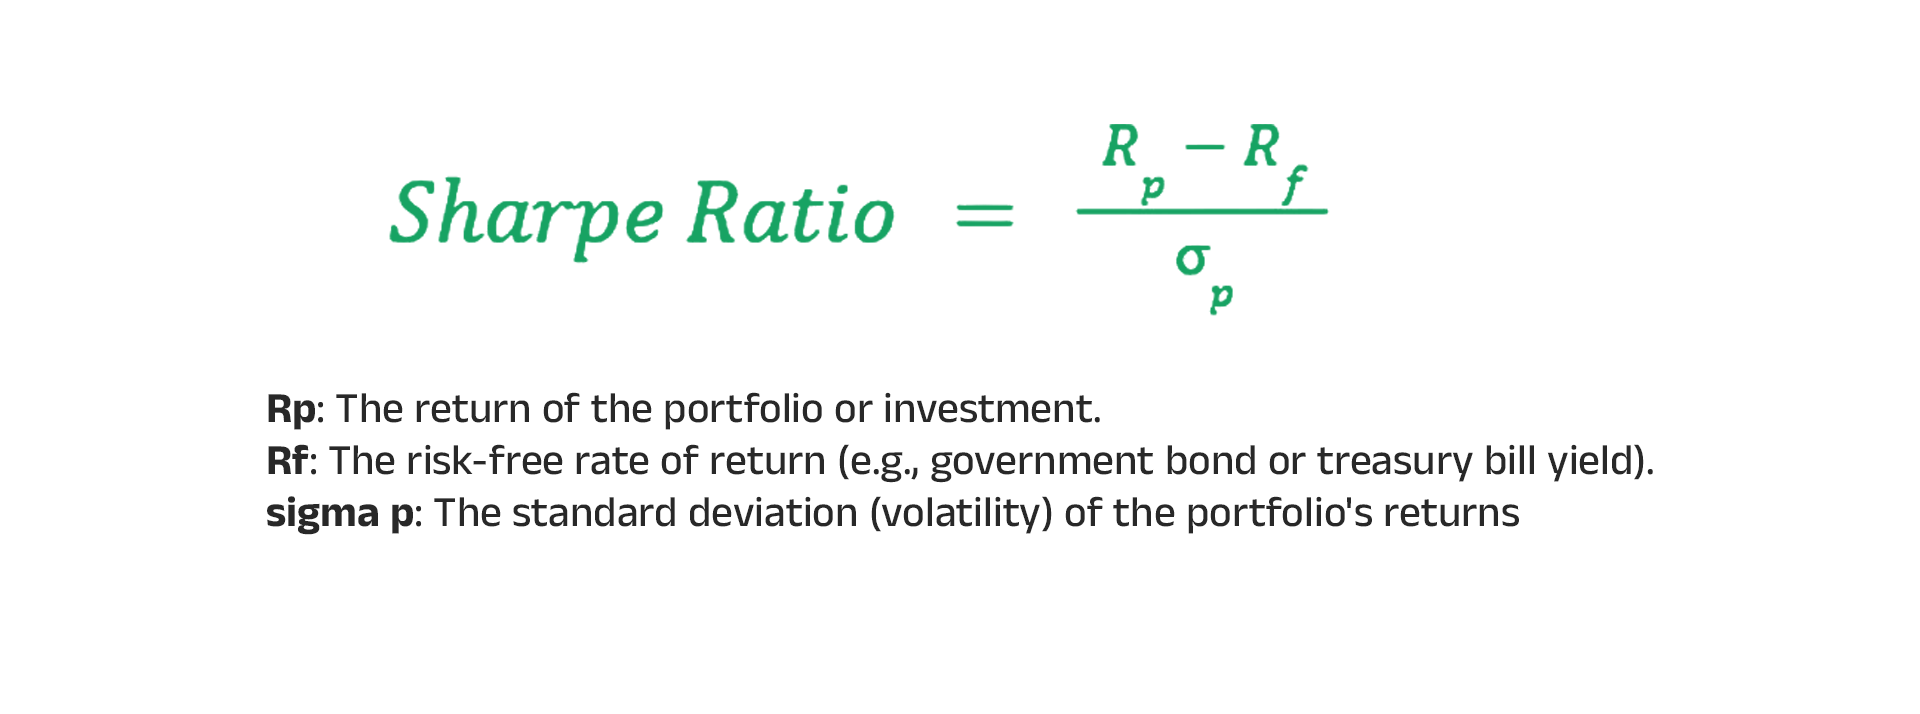
Sharpe Ratio = (Fund Return – Risk-Free Rate) / Standard Deviation
Let’s break that down in plain language.
Fund Return: The average return the fund delivered.
Risk-Free Rate: What you would earn from a “safe” investment—like a government bond or fixed deposit.
Standard Deviation: The volatility, how much the fund’s returns swing up and down.
The formula subtracts the risk-free rate from the fund’s return. This gives you the excess return, the extra return you earned for taking a risk instead of just putting your money in a safe asset.
Then, it divides that excess return by the standard deviation. This tells you how much excess return you earned for each unit of risk you took.
A higher Sharpe Ratio means better risk-adjusted returns. It means the fund delivered more return for the risk it took.
Think of it like this. Two funds both gave you 15% returns.
But one had a Sharpe Ratio of 1.2, and the other had 0.8.
The first fund gave you those returns with less volatility, a smoother ride. The second fund made you sweat for the same returns.
That’s why the Sharpe Ratio is so widely used. It’s simple. It’s powerful. And it’s stood the test of time.
Today, banks, mutual fund houses, pension funds, and individual investors all use it. It’s the gold standard for evaluating fund performance.
But how do you actually use it in practice? What’s a good Sharpe Ratio?
Let’s find out.
What is a Good Sharpe Ratio?
Here’s a simple rule of thumb:
A Sharpe Ratio greater than the benchmark’s Sharpe Ratio is what you should look for. That means the fund delivered better risk-adjusted returns than the index.
If the fund’s Sharpe Ratio is lower than the benchmark’s, it means the fund took more risk for less return—which is not a good sign.
So don’t just look at the number in isolation. Always compare it to the benchmark. That’s the only way to know if the fund is truly delivering value.
But here’s the catch. You can’t compare Sharpe Ratios across different categories.
A large cap fund and a mid cap fund have different risk profiles.
Comparing their Sharpe Ratios directly doesn’t make sense.
Always compare funds within the same category.
A flexi cap fund should be compared to other flexi cap funds.
A mid cap fund should be compared to other mid cap funds.
Now, let’s look at our data again.
Motilal Oswal’s Sharpe Ratio is 0.76. Sundaram’s is 0.53. Both are in the “acceptable” range.
But Motilal Oswal clearly delivers more return per unit of risk.
This is the power of the Sharpe Ratio.
It cuts through the noise. It tells you which fund is truly efficient with your money.
Properly comparing mutual funds requires more than just looking at their return numbers.
But here’s something important. Sharpe Ratio is powerful, but it’s not perfect.
It has limitations. And if you rely on it alone, you might still make mistakes.
Section 4: Should You Rely Only on Sharpe Ratio?
Sharpe Ratio is useful. But it’s not perfect. Like any number, it has its limits.
Here’s what the Sharpe Ratio doesn’t tell you:
It assumes returns are evenly spread. In simple terms, it assumes big ups and downs are rare.
But markets don’t always behave nicely.
Extreme events, like the 2008 crash or the 2020 COVID crash, happen more often than the math predicts.
It doesn’t show the full picture of risk. Sharpe Ratio treats all volatility the same.
But in reality, investors hate losses more than they love gains.
A fund with small, frequent losses might look similar to a fund with one massive loss.
But your experience as an investor would be completely different.
It looks at the past. Sharpe Ratio is calculated using historical data. It tells you how the fund performed. It doesn’t guarantee future performance.
This is why we don’t rely on any single metric at iNVESTT.in
We look at multiple factors, such as consistency, how often a fund beats its benchmark, and risk-adjusted returns, before we recommend anything.
We’ve spent years building a system that combines these factors into a clear, repeatable process. It’s what helps us separate genuinely good funds from the ones that just got lucky.
If you want to see exactly how this system works, with real fund examples and a
step-by-step process, check out our guide. It explains everything in simple terms.
Section 5: Conclusion
Let’s quickly recap what we covered.
Sharpe Ratio tells you if a fund’s returns were worth the risk. It’s a simple number that cuts through the noise. A higher Sharpe Ratio means better risk-adjusted returns.
It was introduced by William F. Sharpe to solve a real problem, how to compare funds with different risk profiles. Today, it’s used by banks, mutual fund houses, and smart investors everywhere.
But here’s the thing. Sharpe Ratio alone isn’t enough. It’s just one piece of the puzzle. To select truly great funds, you need to look at consistency and how often a fund beats its benchmark too.
That’s exactly what our “7 Insider Secrets to Select a Winning Mutual Fund” guide teaches. It walks you through the complete system, rolling returns, chance of beating the market, and Sharpe Ratio, with real fund examples.
If you’re tired of guessing and want a clear, repeatable process, this guide is for you.
Don’t just chase returns. Start measuring risk-adjusted returns. That’s how smart investors win.
Disclaimer:
This article is for educational and informational purposes only and should not be construed as investment advice, investment recommendation, or solicitation to buy, sell, or hold any securities.
The views and opinions expressed are based on information believed to be reliable as on the date of publication. However, no representation or warranty is made regarding the accuracy, completeness, or adequacy of the information.
Investments in securities are subject to market risks. Readers should conduct their own research and consult their financial adviser before making any investment decisions.
SEBI Registration No.: INH000010858
Analyst Name: Gopi Krishna Matcha