
Introduction
Mutual fund comparison. Two funds. Ten different numbers. No clear winner.
You have been there. You open two fund fact sheets, compare mutual fund returns. One has higher returns. The other has lower expenses. One has a better Sharpe ratio. The other has a bigger AUM. You stare at the screen. Then you give up and pick randomly.
That is not your fault. Most comparison methods are broken. They throw too many metrics at you with no priority. No process. No way to decide.
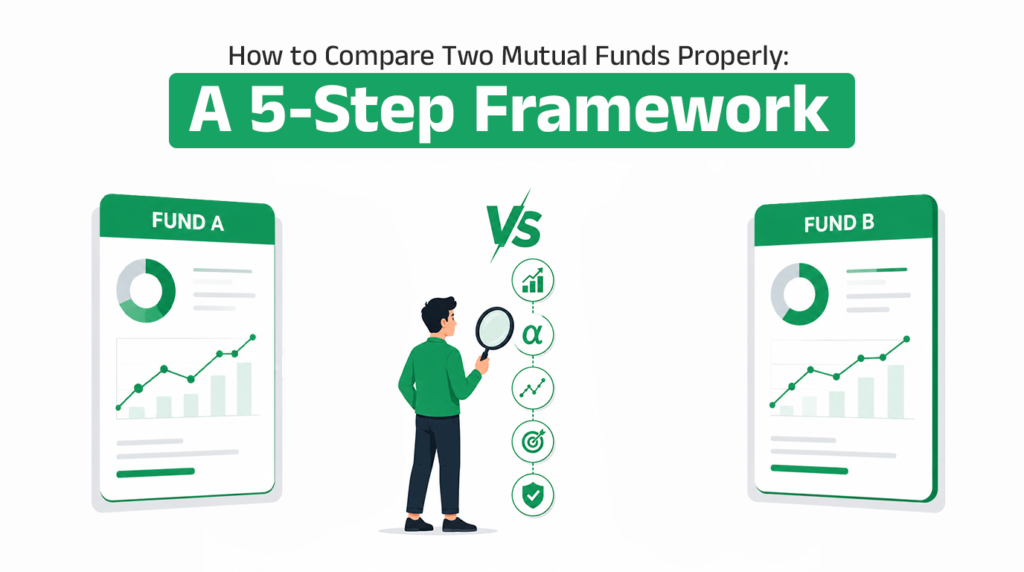
Let us fix that with a simple framework. Step by step.
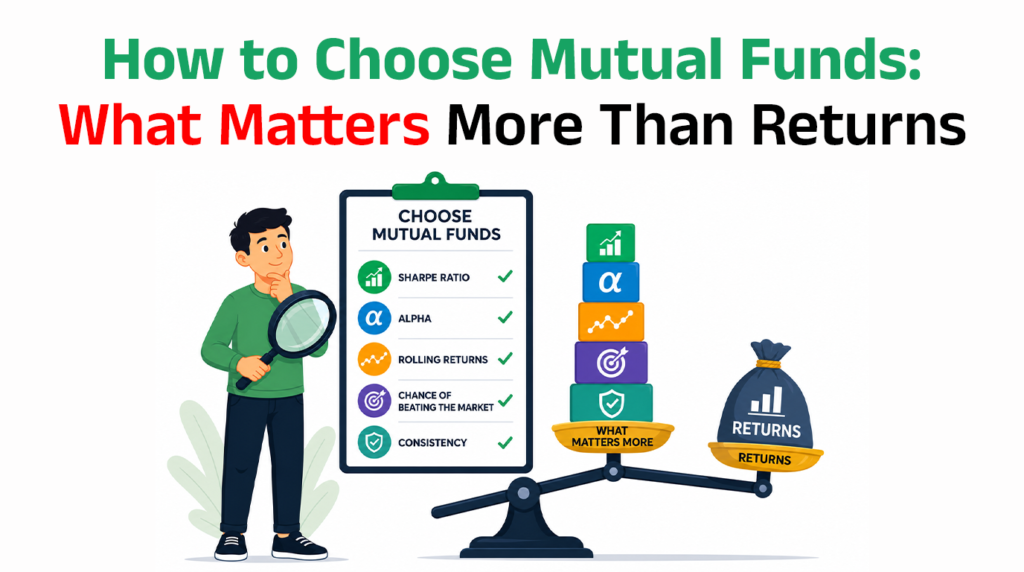
The Two-Table Framework
Let us compare four Large Cap funds. Same category. Fair comparison.
Now let us walk through the framework step by step.
Step 1 – Check The Basics
Before you compare any two funds, check three basic things.
Same category?
Look at the Table All four funds are Large Cap funds.
That means they invest in similar types of companies.
You are comparing apples to apples.
Never compare a Large Cap fund with a Mid Cap fund. That comparison makes no sense.
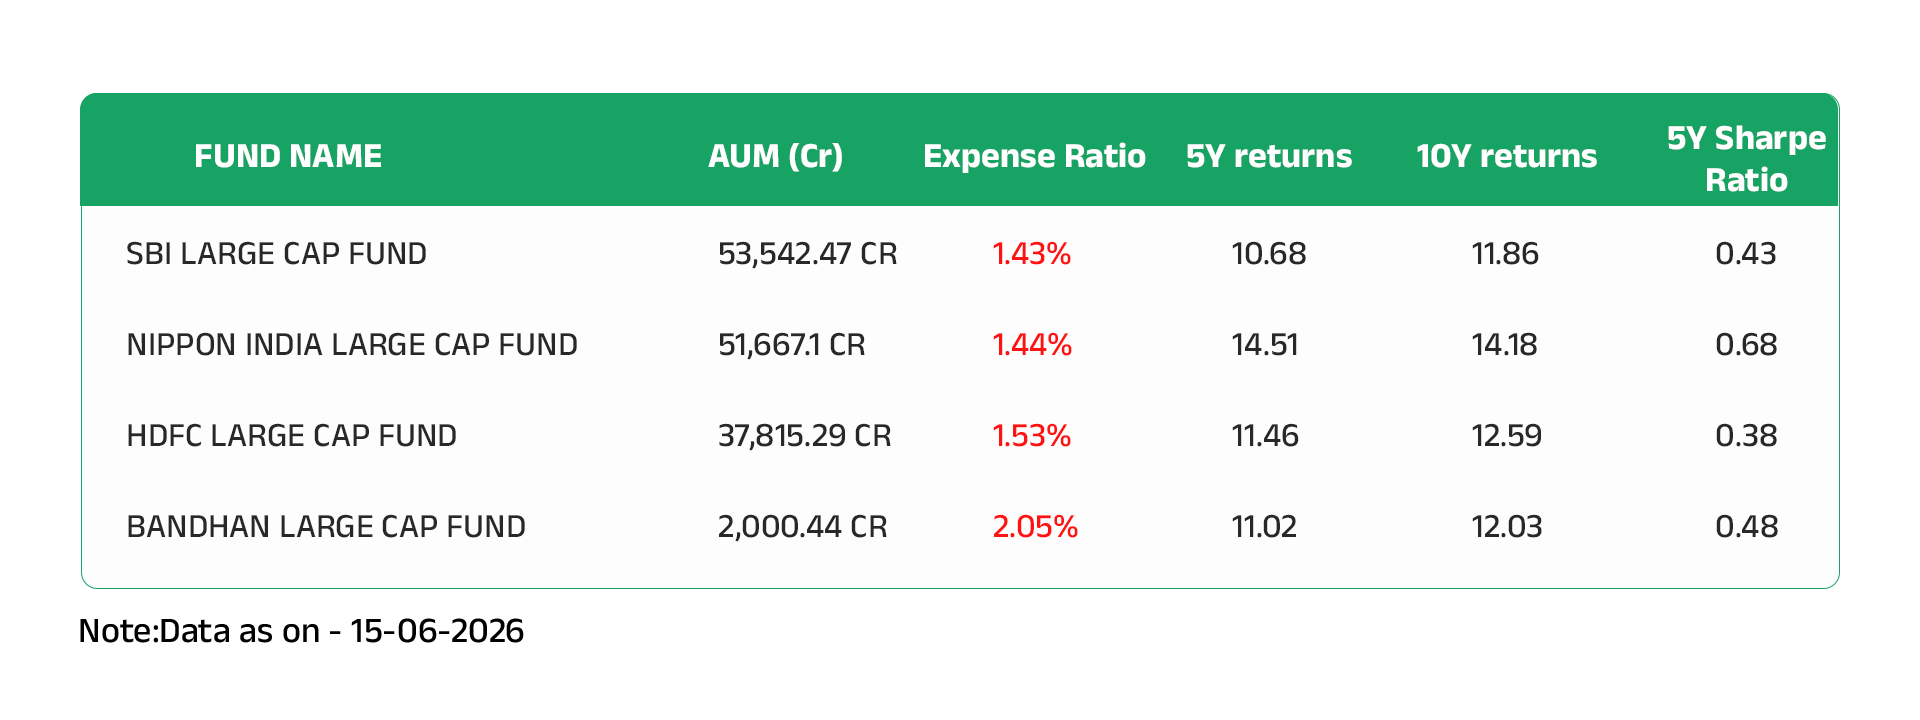
AUM?
SBI and Nippon are massive at over 50,000 crores each.
HDFC is close to 38,000 crores. Bandhan is smaller at 2,000 crores.
All are large enough to be stable. Very small AUM (under 500 crores) can be a red flag. That is not the case here.
Expense ratio?
Bandhan has the highest at 2.05%. The others are between 1.43% and 1.53%.
Higher expenses eat into your returns over time.
But do not reject a fund only for this. Look at the full picture.
No knockout yet. All three basics check out. Let us go deeper.
Step 2 – Compare Returns Across Time
Now look at Table, Check the 5-year and 10-year returns together.
Nippon shows 14.51% over 5 years and 14.18% over 10 years. That is consistency. The fund has delivered similar performance across both time periods.
SBI shows 10.68% over 5 years and 11.86% over 10 years. Slightly lower recently but still respectable.
HDFC shows 11.46% over 5 years and 12.59% over 10 years. Again, a small dip in the recent 5-year period.
Bandhan shows 11.02% over 5 years and 12.03% over 10 years. Similar pattern.
On returns alone, Nippon stands out. But remember what we learned in What Matters More Than Returns. Returns are not the full story.
A fund with high returns but high risk can hurt you. A fund with slightly lower returns but better risk management can be a better choice for long-term peace of mind.
So let us look at risk next.
Step 3 – Look At Risk (Sharpe Ratio)
Returns tell you how much money a fund made. Sharpe ratio tells you how much risk it took to make that money.
Higher Sharpe ratio means better risk-adjusted returns. Lower Sharpe ratio means the fund took more risk for the same return.
Look at Table again.
Nippon has the highest Sharpe ratio at 0.68. It delivered strong returns without taking excessive risk.
Bandhan is next at 0.48. Acceptable but not outstanding.
SBI follows at 0.43.
HDFC has the lowest at 0.38. Its returns look decent at 11.46% over 5 years. But the risk taken to achieve those returns was higher than the other funds.
Here is a simple rule.
Between two funds with similar returns, pick the one with the higher Sharpe ratio.
Between two funds with similar Sharpe ratio, pick the one with higher returns.
Nippon wins on both counts so far. But we are not done. Consistency matters too.
Step 4 – Check Consistency & Downside Protection
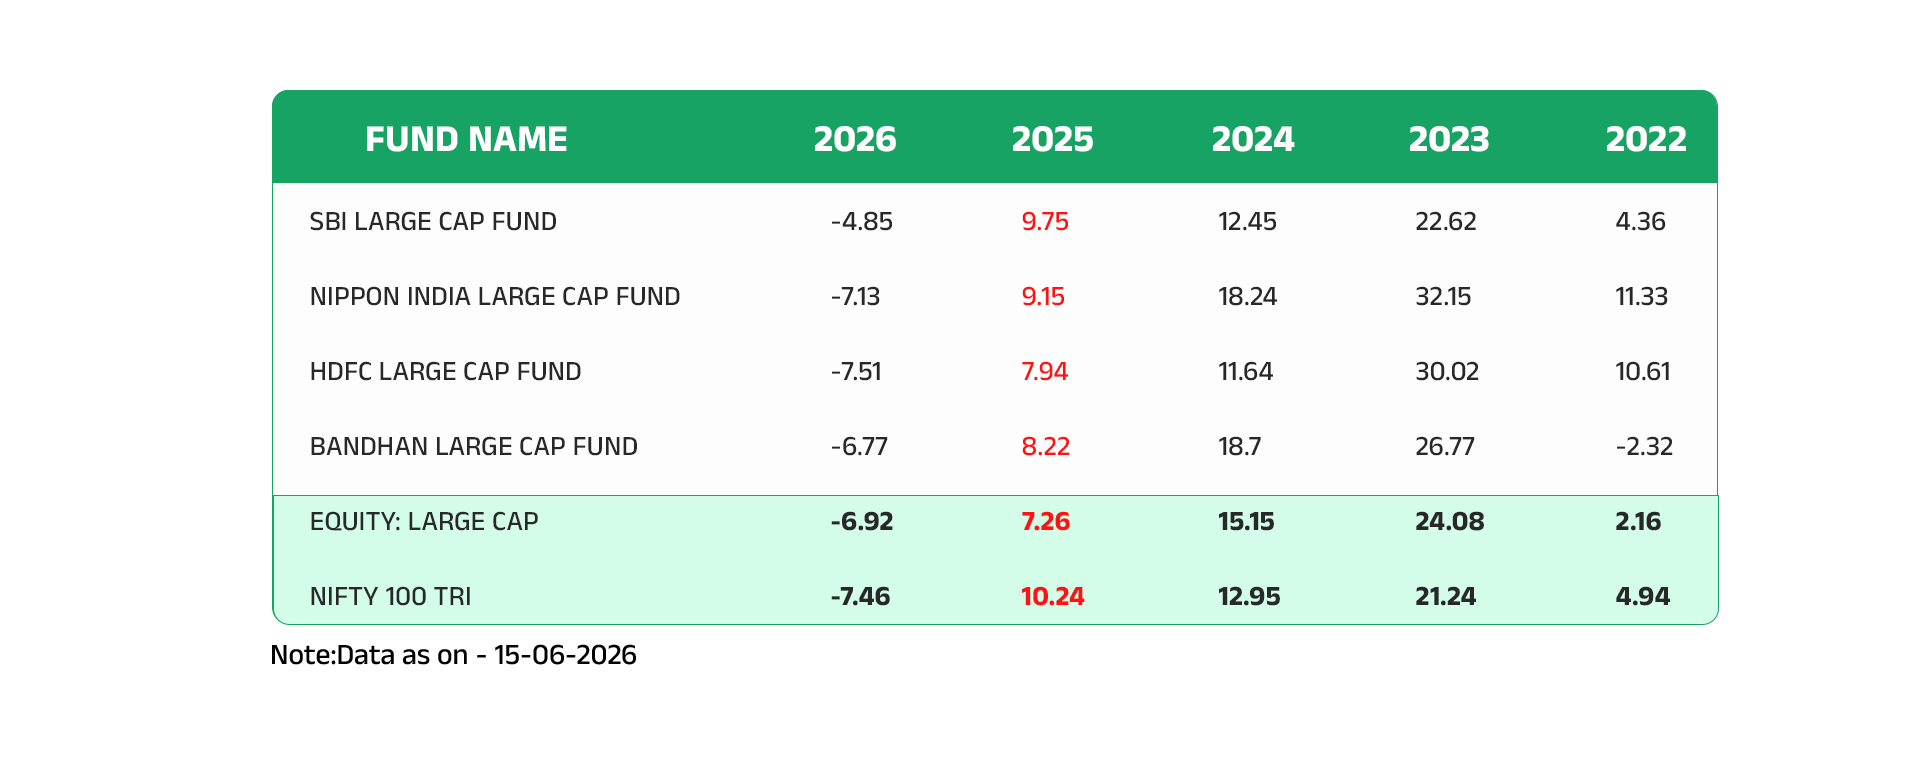
Now look at Table 1. This is where you see the real story.
First, how many years did each fund beat the benchmark?
The benchmark is NIFTY 100 TRI. A fund’s job is to beat its benchmark. Not once. Not in good years only. Consistently.
Here is the count for 2022 to 2026.
Nippon beat the benchmark in 4 out of 5 years. That is strong consistency.
HDFC beat it in 3 years. Bandhan also in 3 years. SBI beat it in only 2 years.
A fund that beats its benchmark in most years is reliable. A fund that fails half the time is not doing its job.
Second, how does each fund behave in down years?
Look at 2026. The benchmark fell -7.46%.
SBI fell only -4.85%. That is good downside protection. Bandhan fell -6.77%. Also better than the benchmark.
Nippon fell -7.13%. Slightly better than the benchmark. HDFC fell -7.51%. Slightly worse.
Why does this matter? A fund that falls less in bad years helps you stay invested. You panic less. You sell less. You stay for the recovery.
Now you have all the pieces. Returns. Risk. Consistency. Downside protection.
Let us put them together.
Putting It All Together
Let us step back and look at what the data tells us.
Nippon delivered the highest returns over 5 and 10 years. It has the best Sharpe ratio, meaning those returns came with better risk management. It beat the benchmark in 4 out of 5 years. In the 2026 down year, it fell slightly less than the benchmark.
SBI had lower returns and beat the benchmark only twice. But in 2026, it fell only -4.85% when the benchmark fell -7.46%. That is strong downside protection.
Bandhan had similar returns to SBI and HDFC. It beat the benchmark in 3 out of 5 years. Its downside protection in 2026 was good at -6.77%. But its expense ratio is the highest at 2.05%.
HDFC had decent returns but the lowest Sharpe ratio. It beat the benchmark in 3 out of 5 years. In 2026, it fell slightly more than the benchmark.
So which fund is right for you?
That depends on what you value most.
If you want higher returns and strong consistency, Nippon makes a strong case.
If you are more concerned about protecting your money in down years, SBI or Bandhan might feel more comfortable.
If low expenses matter to you, Bandhan’s 2.05% might be a concern.
There is no single correct answer. The right fund is the one that fits your goals and your comfort with risk.
A Simple Framework You Can Use
Now you have seen the process. Here is the framework you can use for any fund comparison.
Step 1: Check the basics
Make sure you are comparing funds from the same category. Check AUM (avoid very small funds). Note the expense ratio.
Step 2: Compare returns across time
Look at 5-year and 10-year returns together. One good year does not make a good fund.
Step 3: Look at risk
Check Sharpe ratio. Higher is better. Between two funds with similar returns, pick the one with higher Sharpe.
Step 4: Check consistency and downside
How many years did the fund beat its benchmark? How did it perform in down years? A fund that protects your capital in bad years is valuable.
Step 5: Decide based on your goals
There is no perfect fund. Higher returns often come with higher risk.
Better downside protection may come with lower returns.
You decide what matters more for your situation.
That is it. Five steps. No confusion.
Conclusion
Mutual fund comparison does not have to be hard. You just need a process.
Start with the basics. AUM. Expense ratio.
Look at returns across 5 and 10 years.
Check risk with Sharpe ratio.
Verify consistency and downside protection.
Then decide based on your own goals.
That is the framework. Use it every time you compare funds.
If you still feel stuck comparing your own funds, you are not alone. Many investors understand the steps but need help applying them to their specific situation and time period.
Book a call with us. We will look at your funds together and help you decide.
Disclaimer:
This article is for educational and informational purposes only and should not be construed as investment advice, investment recommendation, or solicitation to buy, sell, or hold any securities.
The views and opinions expressed are based on information believed to be reliable as on the date of publication. However, no representation or warranty is made regarding the accuracy, completeness, or adequacy of the information.
Investments in securities are subject to market risks. Readers should conduct their own research and consult their financial adviser before making any investment decisions.
SEBI Registration No.: INH000010858
Analyst Name: Gopi krishna Matcha

Pingback: Flexi Cap vs Large Cap: How to Choose the Right Category