Introduction
You compared two funds. Picked the one with higher returns. Then watched it underperform for two years. What went wrong?
This happens more often than you think. You look at returns. You compare numbers. You make a decision. And somehow, the fund you picked does not deliver what the numbers promised.
The problem is not you. The problem is how most investors compare mutual funds.
You compare returns, pick the highest number, and then wonder why the fund underperforms. We have covered this before in Stop Chasing Last Year’s Top Mutual Funds, where the data shows exactly why chasing past winners fails.
You are not alone. Almost every investor makes the same mistakes.
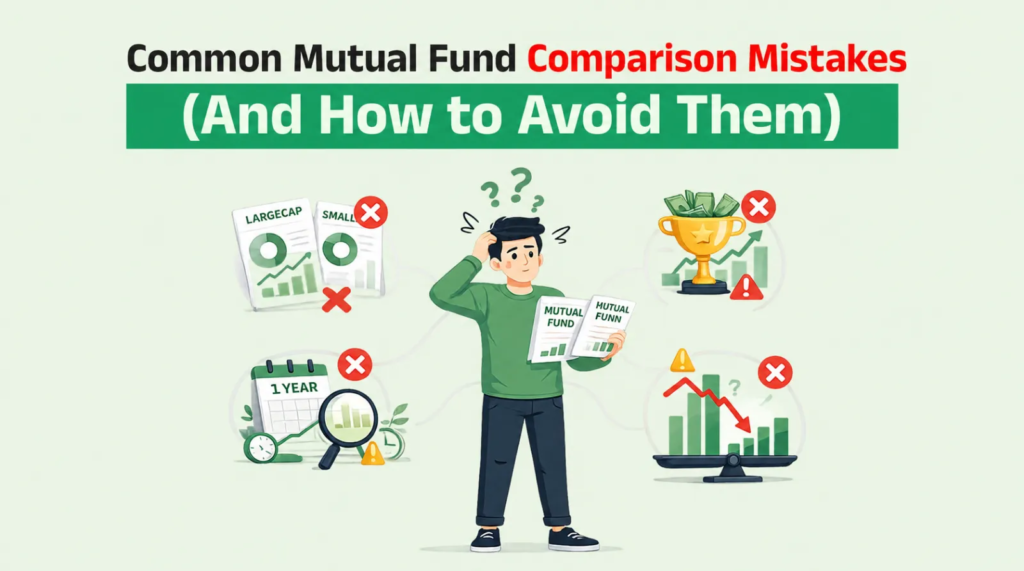
Let us walk through the most common ones. And more importantly, how to fix them. Process of mutual fund comparison in the right way.
Mistake #1 – Comparing Across Categories
Here is a common scene. You see a Small Cap fund with 18% returns. You see a Large Cap fund with 12% returns. You pick the Small Cap fund because higher returns look better.
This is unfair. Small Cap funds invest in smaller companies. They take more risk. In good years, they deliver higher returns. In bad years, they fall deeper. Large Cap funds invest in established companies. They are more stable. Lower returns, lower risk.
You cannot compare them directly. They are designed to behave differently.
Only compare funds within the same category. Large Cap with Large Cap. Small Cap with Small Cap. Flexi Cap with Flexi Cap.
Stop Chasing Last Year’s Top Mutual Funds.
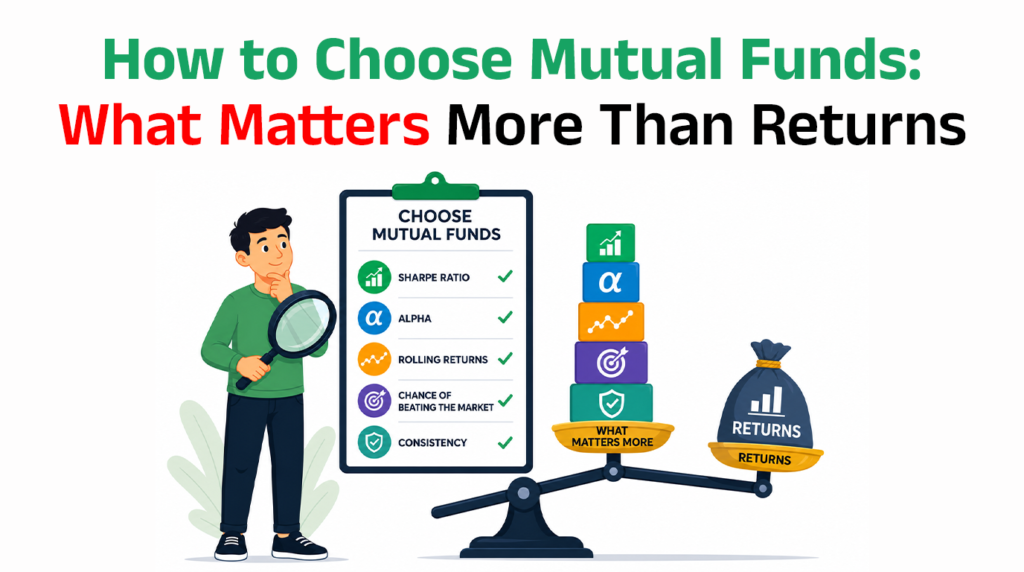
Mistake #2 – Focusing Only On Returns
Returns are easy to find. They are also easy to misinterpret.
Look at the Table Nippon has the highest 5-year return at 14.51%. It also has the highest Sharpe ratio at 0.68. That means it delivered those returns without taking excessive risk.
But what if a fund had high returns and low Sharpe? That would mean it took too much risk to get there. You would never know by looking at returns alone.
A fund with high returns might have taken excessive risk to get there. What Matters More Than Returns explains why consistency and downside behavior matter more than absolute numbers.
HDFC has a 5-year return of 11.46%. That looks decent. But its Sharpe ratio is only 0.38 – the lowest among the four funds. The returns are okay, but the risk taken to achieve them was higher than the others.
Mistake #3 – Ignoring Downside Behavior
Every investor looks at good years. Few look at bad years.
That is a problem. Because how a fund behaves in down years tells you more about its quality than how it performs in good years.
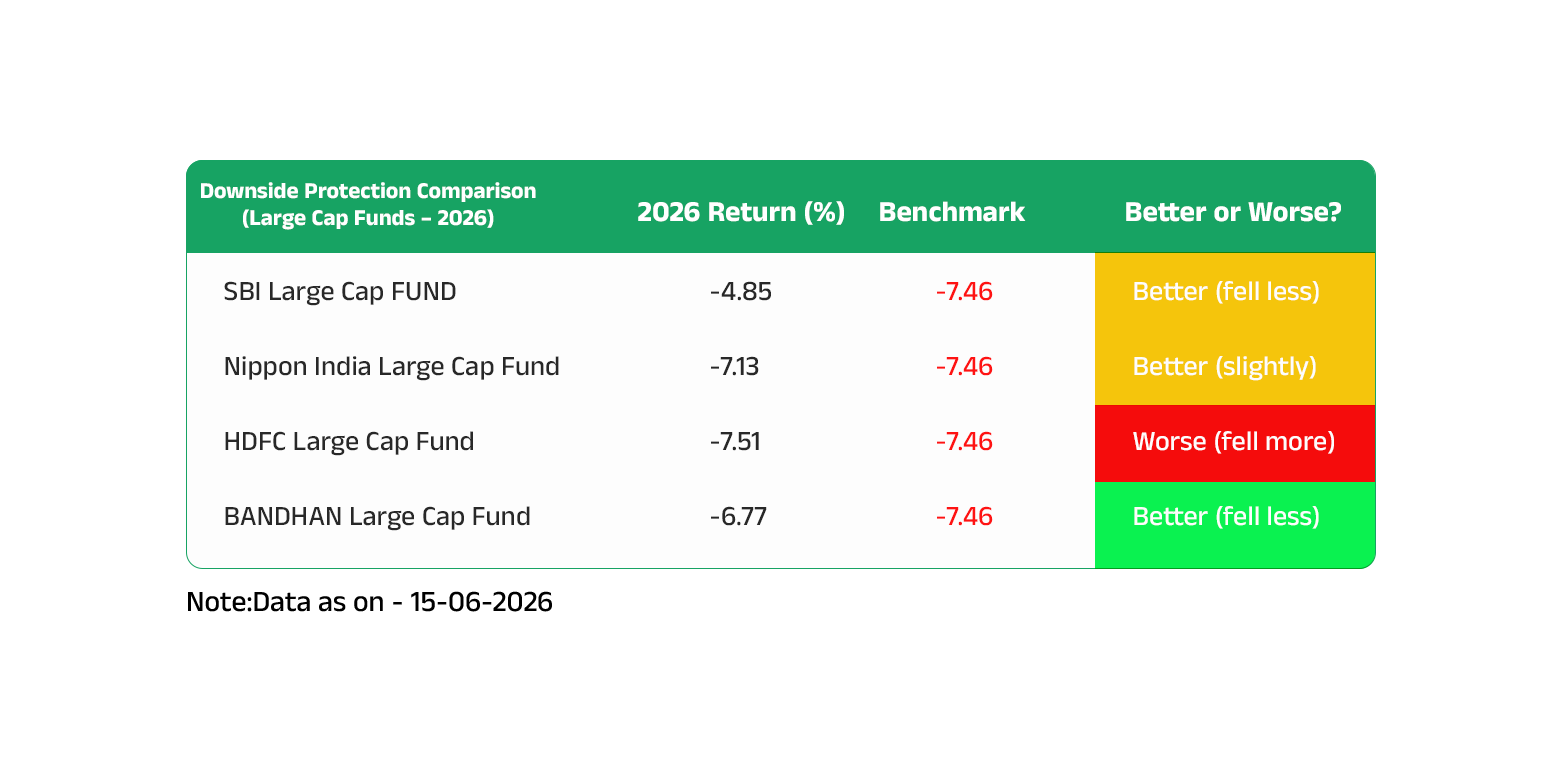
Here is a real example. In 2026, the benchmark fell -7.46%.
One Large Cap fund fell only -4.85%. Another Large Cap fund from the same category fell -7.51%.
Same category. Very different downside protection.
The first fund protected your capital better. You would have lost less. You would have panicked less. You would have stayed invested.
The second fund fell harder than the benchmark. You would have lost more. You would have felt more pain.
Both funds looked similar in good years. In a bad year, the difference became clear.
Do not ignore downside behavior. It matters more than you think.
Mistake #4 – Using Short-Term Data
One year of data tells you nothing.
Here is what happens. You look at last year’s top performer. You invest. Then the fund struggles. You wonder what went wrong.
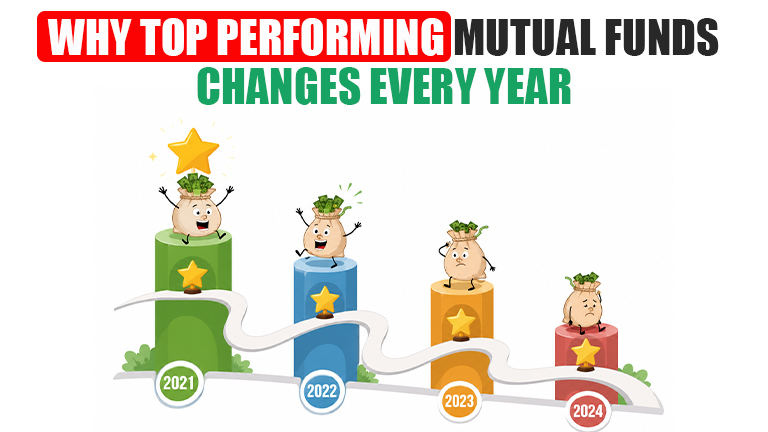
Nothing went wrong. That is just how mutual funds work. The top performer changes almost every year.
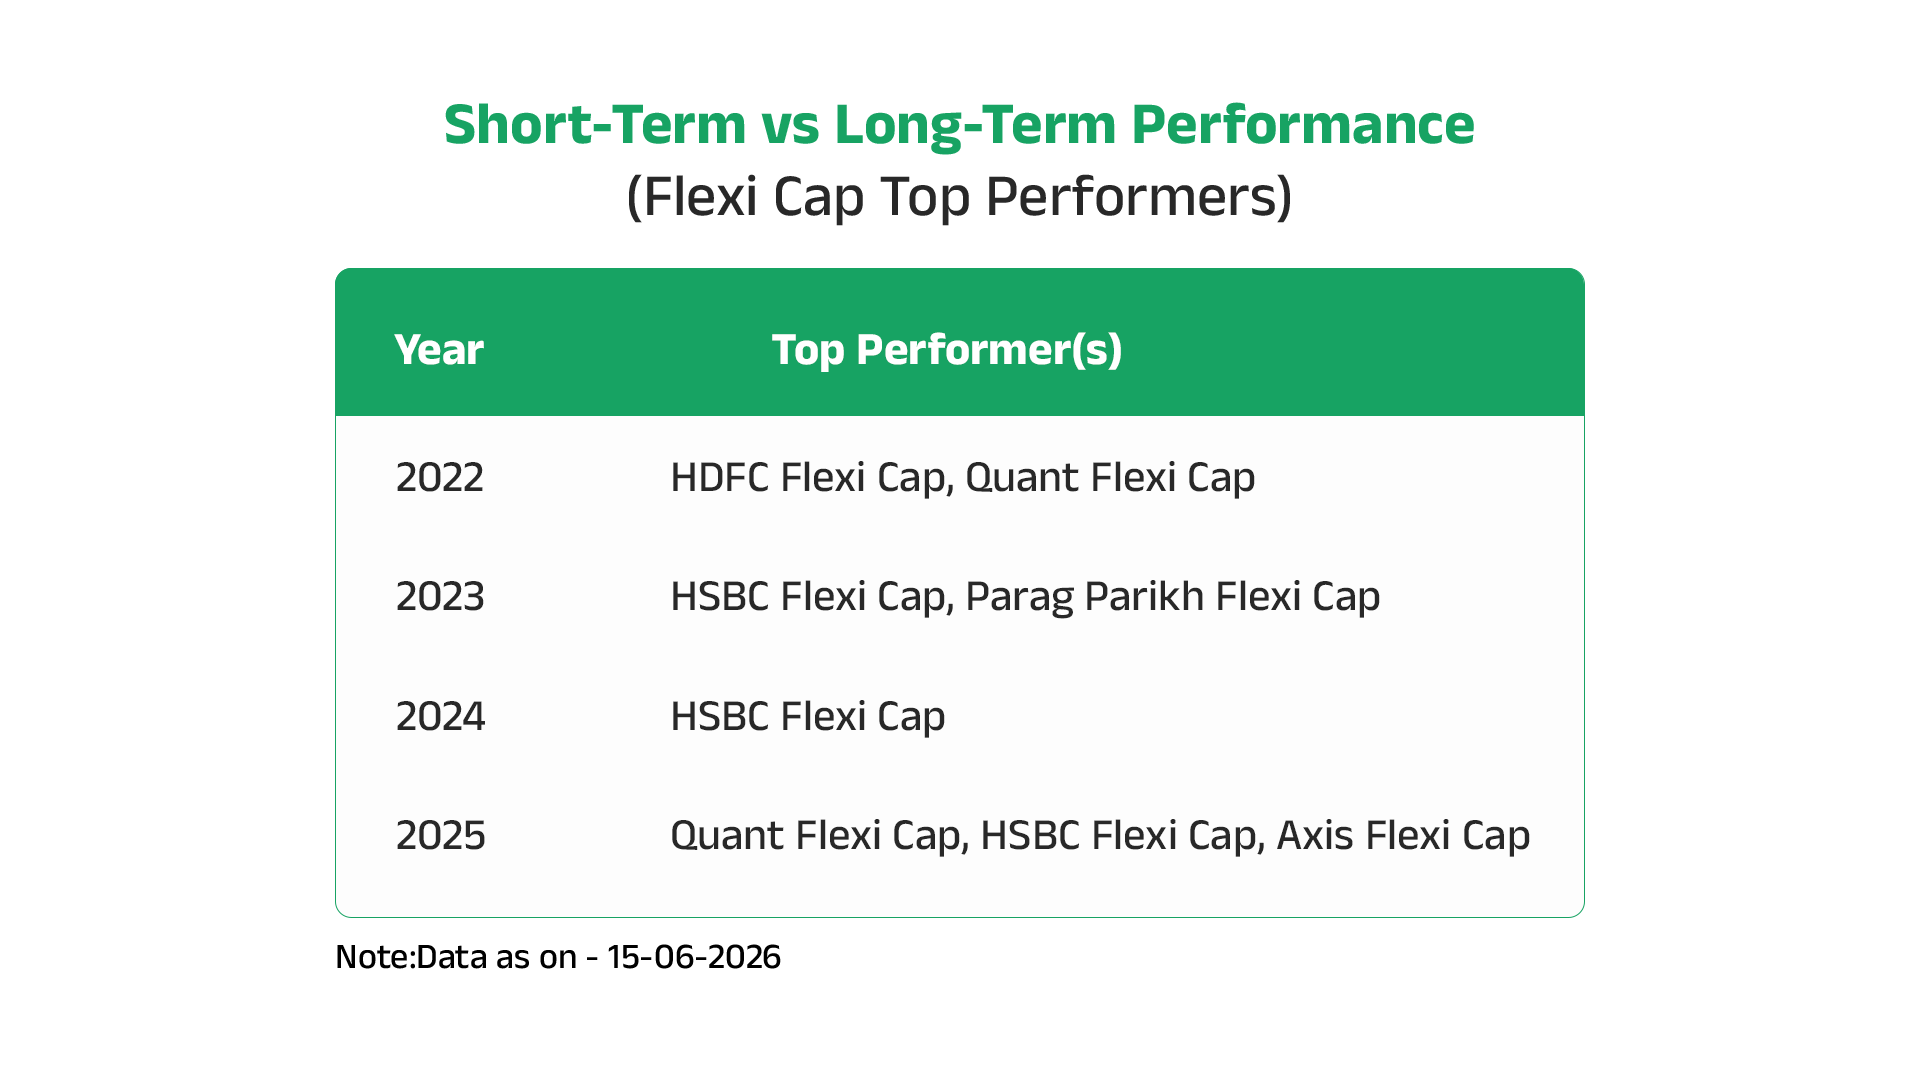 Between 2022 and 2025, the number one spot in Flexi Cap funds changed multiple times. Different funds took turns at the top.
If you picked a fund based only on one year of data, you would have been chasing a moving target.
The number one fund changes almost every year. If you are curious why this happens and want to see the data, Why Top-Performing Funds Change Every Year walks through the exact numbers.
Use 5-year and 10-year data. One year is noise. Three years is a trend. Five years is evidence.
This constant shift in top performers is exactly why short-term data misleads investors.
Mistake #5 – Overweighting Expense Ratio
Expense ratio matters. But it is not the only thing that matters.
Some investors reject a fund the moment they see a higher expense ratio. That is a mistake.
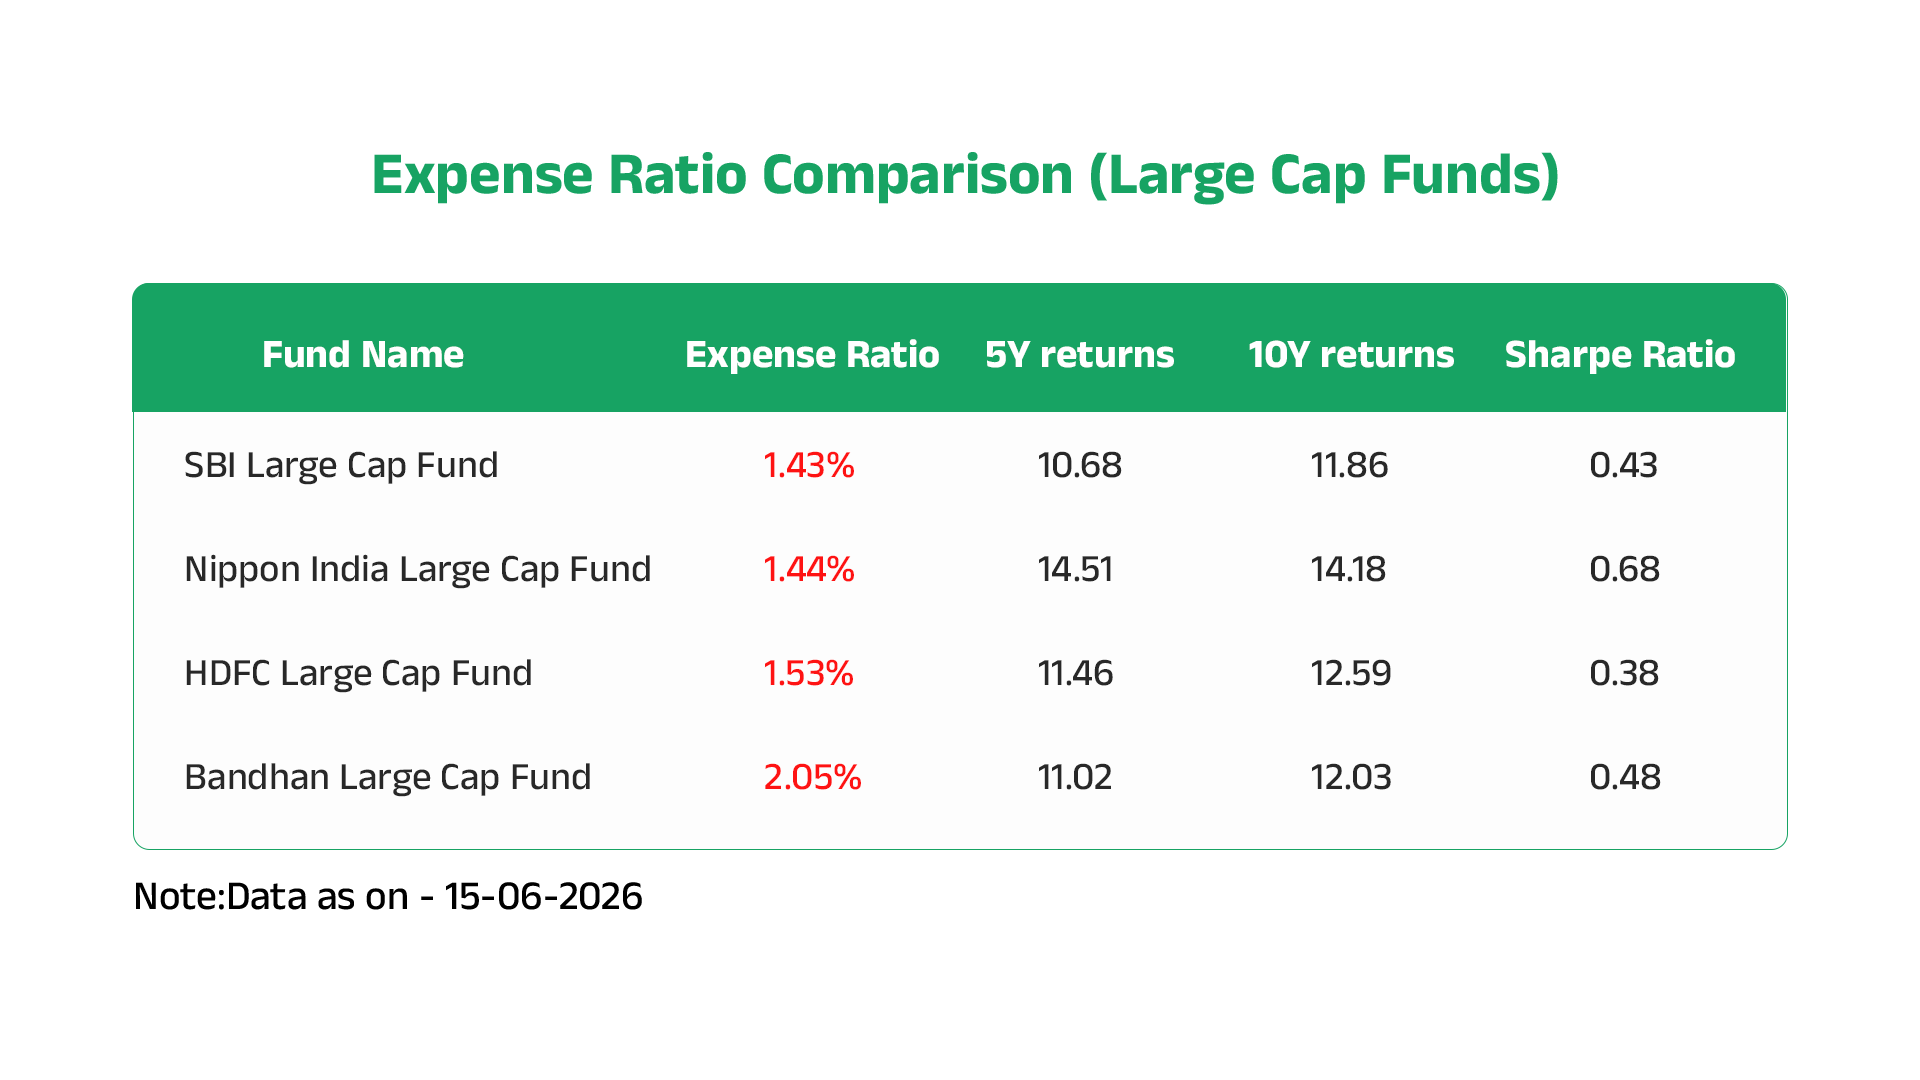
Look at the numbers. One fund has an expense ratio of 2.05%. Another has 1.43%. If you rejected the first fund only for its expense ratio, you would miss that its 5-year returns are similar to the lower-cost fund. Its risk-adjusted performance is actually better than some funds with lower expenses.
Higher expense is a negative. But do not let it override returns, risk, and consistency.
Think of expense ratio as a tiebreaker. Not a knockout punch.
The One Simple Rule
Here is the bottom line.
Stick to the same category. Always. A Large Cap fund and a Small Cap fund play different games. Do not compare them.
When you look at returns, look across time. Not just one year. Not just three. Go back five and ten years. That is where patterns emerge.
Risk matters. Sharpe ratio tells you if the returns were worth the ride.
Downside behavior matters. Some funds protect you in bad years. Some do not. The difference shows up when markets fall.
Expense ratio? Yes, watch it. But do not reject a fund only because it is slightly higher. Look at the full picture first.
Once you avoid these mistakes, you need a proper framework to compare funds the right way. That is exactly what How to Compare Two Mutual Funds Properly covers – a step-by-step process you can use every time.
That is the rule. Simple. Repeatable. It works.
Putting It Together
You now know the five mistakes and how to avoid them.
Do not compare across categories. Do not focus only on returns. Do not ignore downside behavior. Do not use short-term data. Do not overweight expense ratio.
Simple rules. Easy to remember. Hard to apply consistently.
Because here is the truth. Your portfolio is not a textbook example. You have multiple funds. Different goals. Different time horizons. Your own comfort with risk changes over time.
Applying these rules to your specific situation takes work. That is exactly what we help with every day.
Conclusion
Compare mutual fund returns the right way. Avoid these five mistakes.
Compare within the same category. Look at returns across 5 and 10 years. Check Sharpe ratio for risk. Verify downside protection. Use long-term data. Treat expense ratio as a tiebreaker.
That is the framework. Simple. Repeatable.
But knowing the mistakes and applying them to your own portfolio are two different things. Your portfolio has its own mix of funds, goals, and risk comfort.
If you want a fresh pair of eyes on your fund comparisons, book a call with us. We will look at your portfolio together.
Disclaimer:
This article is for educational and informational purposes only and should not be construed as investment advice, investment recommendation, or solicitation to buy, sell, or hold any securities.
The views and opinions expressed are based on information believed to be reliable as on the date of publication. However, no representation or warranty is made regarding the accuracy, completeness, or adequacy of the information.
Investments in securities are subject to market risks. Readers should conduct their own research and consult their financial adviser before making any investment decisions.
SEBI Registration No.: INH000010858
Analyst Name: Gopi krishna Matcha